lattpy.shape
Objects for representing the shape of a finite lattice.
- class lattpy.shape.Shape(shape, pos=None, basis=None)[source]
Bases:
AbstractShapeGeneral shape object.
Examples
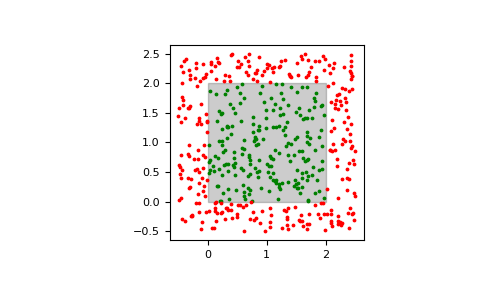
Cartesian coordinates
>>> points = np.random.uniform(-0.5, 2.5, size=(500, 2))
>>> s = lp.Shape((2, 2))
>>> s.limits()
[[0.  2. ]
 [0.  2.]]
>>> import matplotlib.pyplot as plt
>>> mask = s.contains(points)
>>> s.plot(plt.gca())
>>> plt.scatter(*points[mask].T, s=3, color="g")
>>> plt.scatter(*points[~mask].T, s=3, color="r")
>>> plt.gca().set_aspect("equal")
>>> plt.show()

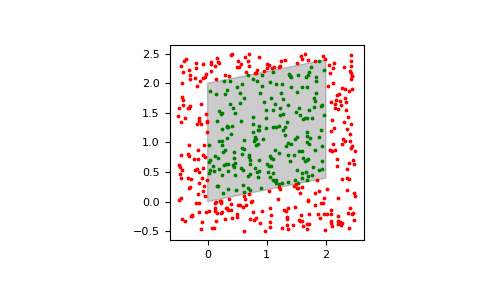
Angled coordinate system
>>> s = lp.Shape((2, 2), basis=[[1, 0.2], [0, 1]])
>>> s.limits()
[[0.  2. ]
 [0.  2.4]]
>>> mask = s.contains(points)
>>> s.plot(plt.gca())
>>> plt.scatter(*points[mask].T, s=3, color="g")
>>> plt.scatter(*points[~mask].T, s=3, color="r")
>>> plt.gca().set_aspect("equal")
>>> plt.show()

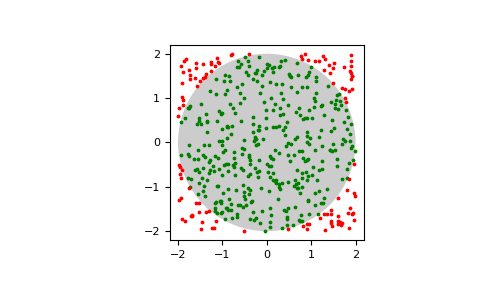
- class lattpy.shape.Circle(pos, radius)[source]
Bases:
AbstractShapeCircle shape.
Examples
>>> s = lp.Circle((0, 0), radius=2)
>>> s.limits()
[[-2.  2.]
 [-2.  2.]]
>>> import matplotlib.pyplot as plt
>>> points = np.random.uniform(-2, 2, size=(500, 2))
>>> mask = s.contains(points)
>>> s.plot(plt.gca())
>>> plt.scatter(*points[mask].T, s=3, color="g")
>>> plt.scatter(*points[~mask].T, s=3, color="r")
>>> plt.gca().set_aspect("equal")
>>> plt.show()
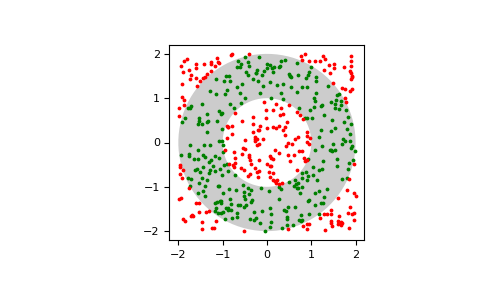
- class lattpy.shape.Donut(pos, radius_outer, radius_inner)[source]
Bases:
AbstractShapeCircle shape with cut-out in the middle.
Examples
>>> s = lp.Donut((0, 0), radius_outer=2, radius_inner=1)
>>> s.limits()
[[-2.  2.]
 [-2.  2.]]
>>> import matplotlib.pyplot as plt
>>> points = np.random.uniform(-2, 2, size=(500, 2))
>>> mask = s.contains(points)
>>> s.plot(plt.gca())
>>> plt.scatter(*points[mask].T, s=3, color="g")
>>> plt.scatter(*points[~mask].T, s=3, color="r")
>>> plt.gca().set_aspect("equal")
>>> plt.show()

- class lattpy.shape.ConvexHull(points)[source]
Bases:
AbstractShapeShape defined by convex hull of arbitrary points.
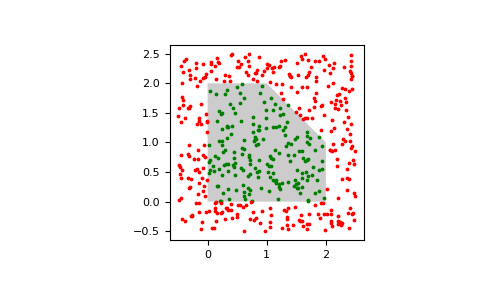
Examples
>>> s = lp.ConvexHull([[0, 0], [2, 0], [2, 1], [1, 2], [0, 2]])
>>> s.limits()
[[0.  2.]
 [0.  2.]]
>>> import matplotlib.pyplot as plt
>>> points = np.random.uniform(-0.5, 2.5, size=(500, 2))
>>> mask = s.contains(points)
>>> s.plot(plt.gca())
>>> plt.scatter(*points[mask].T, s=3, color="g")
>>> plt.scatter(*points[~mask].T, s=3, color="r")
>>> plt.gca().set_aspect("equal")
>>> plt.show()
