lattpy.plotting
Contains plotting tools for the lattice and other related objects.
- lattpy.plotting.subplot(dim, adjustable='box', ax=None)[source]
Generates a two- or three-dimensional subplot with a equal aspect ratio
- Parameters:
- dimint
The dimension of the plot.
- adjustableNone or {‘box’, ‘datalim’}, optional
If not None, this defines which parameter will be adjusted to meet the equal aspect ratio. If ‘box’, change the physical dimensions of the Axes. If ‘datalim’, change the x or y data limits. Only applied to 2D plots.
- axAxes, optional
Existing axes to format. If an existing axes is passed no new figure is created.
- Returns:
- figFigure
The figure of the subplot.
- axAxes
The newly created or formatted axes of the subplot.
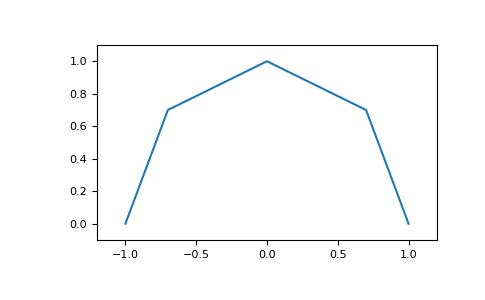
- lattpy.plotting.draw_line(ax, points, **kwargs)[source]
Draw a line segment between multiple points.
- Parameters:
- axAxes
The axes for drawing the line segment.
- points(N, D) np.ndarray
A list of points between the line is drawn.
- **kwargs
Additional keyword arguments for drawing the line.
- Returns:
- collLine2D or Line3D
The created line.
Examples
>>> from lattpy import plotting
>>> import matplotlib.pyplot as plt
>>> fig, ax = plt.subplots()
>>> points = np.array([[1, 0], [0.7, 0.7], [0, 1], [-0.7, 0.7], [-1, 0]])
>>> _ = plotting.draw_line(ax, points)
>>> ax.margins(0.1, 0.1)
>>> plt.show()
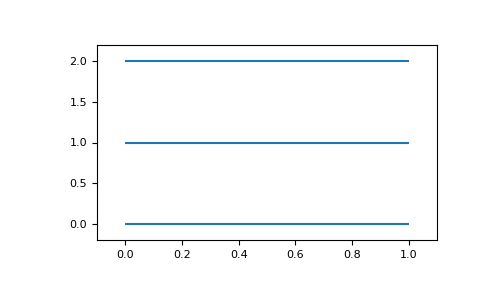
- lattpy.plotting.draw_lines(ax, segments, **kwargs)[source]
Draw multiple line segments between points.
- Parameters:
- axAxes
The axes for drawing the lines.
- segmentsarray_like of (2, D) np.ndarray
A list of point pairs between the lines are drawn.
- **kwargs
Additional keyword arguments for drawing the lines.
- Returns:
- coll: LineCollection or Line3DCollection
The created line collection.
Examples
>>> from lattpy import plotting
>>> import matplotlib.pyplot as plt
>>> fig, ax = plt.subplots()
>>> segments = np.array([
...     [[0, 0], [1, 0]],
...     [[0, 1], [1, 1]],
...     [[0, 2], [1, 2]]
... ])
>>> _ = plotting.draw_lines(ax, segments)
>>> ax.margins(0.1, 0.1)
>>> plt.show()

- lattpy.plotting.hide_box(ax, axis=False)[source]
Remove the box and optionally the axis of a plot.
- Parameters:
- axAxes
The axes to remove the box.
- axisbool, optional
If True the axis are hiden as well as the box.
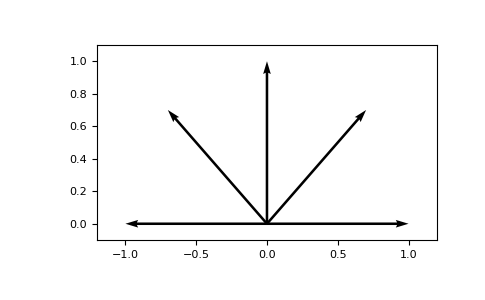
- lattpy.plotting.draw_arrows(ax, vectors, pos=None, **kwargs)[source]
Draws multiple arrows from an optional starting point in the given directions.
- Parameters:
- axAxes
The axes for drawing the arrows.
- vectors(N, D) np.ndarray
The vectors to draw.
- pos(D, ) np.ndarray, optional
The starting position of the vectors. The default is the origin.
- **kwargs
Additional keyword arguments for drawing the arrows.
- Returns:
- coll: LineCollection or Line3DCollection
The created line collection.
Examples
>>> from lattpy import plotting
>>> import matplotlib.pyplot as plt
>>> fig, ax = plt.subplots()
>>> vectors = np.array([[1, 0], [0.7, 0.7], [0, 1], [-0.7, 0.7], [-1, 0]])
>>> _ = plotting.draw_arrows(ax, vectors)
>>> ax.margins(0.1, 0.1)
>>> plt.show()

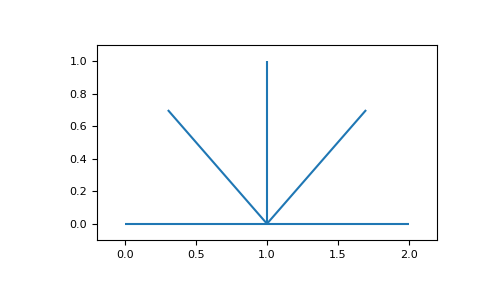
- lattpy.plotting.draw_vectors(ax, vectors, pos=None, **kwargs)[source]
Draws multiple lines from an optional starting point in the given directions.
- Parameters:
- axAxes
The axes for drawing the lines.
- vectors(N, D) np.ndarray
The vectors to draw.
- pos(D, ) np.ndarray, optional
The starting position of the vectors. The default is the origin.
- **kwargs
Additional keyword arguments for drawing the lines.
- Returns:
- coll: LineCollection or Line3DCollection
The created line collection.
Examples
>>> from lattpy import plotting
>>> import matplotlib.pyplot as plt
>>> fig, ax = plt.subplots()
>>> vectors = np.array([[1, 0], [0.7, 0.7], [0, 1], [-0.7, 0.7], [-1, 0]])
>>> _ = plotting.draw_vectors(ax, vectors, [1, 0])
>>> ax.margins(0.1, 0.1)
>>> plt.show()
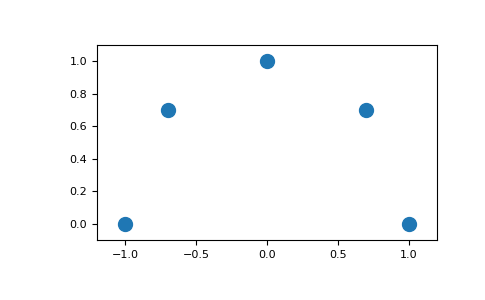
- lattpy.plotting.draw_points(ax, points, size=10, **kwargs)[source]
Draws multiple points as scatter plot.
- Parameters:
- axAxes
The axes for drawing the points.
- points(N, D) np.ndarray
The positions of the points to draw.
- sizefloat, optional
The size of the markers of the points.
- **kwargs
Additional keyword arguments for drawing the points.
- Returns:
- scatPathCollection
The scatter plot item.
Examples
>>> from lattpy import plotting
>>> import matplotlib.pyplot as plt
>>> fig, ax = plt.subplots()
>>> points = np.array([[1, 0], [0.7, 0.7], [0, 1], [-0.7, 0.7], [-1, 0]])
>>> _ = plotting.draw_points(ax, points)
>>> ax.margins(0.1, 0.1)
>>> plt.show()

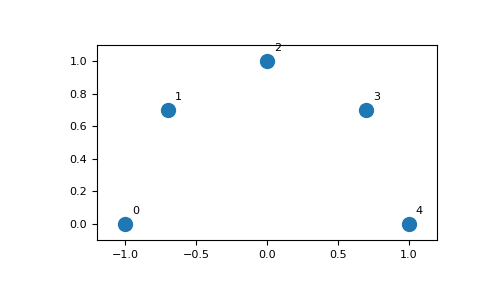
- lattpy.plotting.draw_indices(ax, positions, offset=0.05, **kwargs)[source]
Draws the indices of the given positions on the plot.
- Parameters:
- axAxes
The axes for drawing the text.
- positions(…, D) array_like
The positions of the texts.
- offsetfloat or (D, ) array_like
The offset of the positions of the texts.
- **kwargs
Additional keyword arguments for drawing the text.
- Returns:
- textslist
The text items.
Examples
>>> from lattpy import plotting
>>> import matplotlib.pyplot as plt
>>> points = np.array([[-1, 0], [-0.7, 0.7], [0, 1], [0.7, 0.7], [1, 0]])
>>> fig, ax = plt.subplots()
>>> _ = plotting.draw_points(ax, points)
>>> _ = plotting.draw_indices(ax, points)
>>> ax.margins(0.1, 0.1)
>>> plt.show()

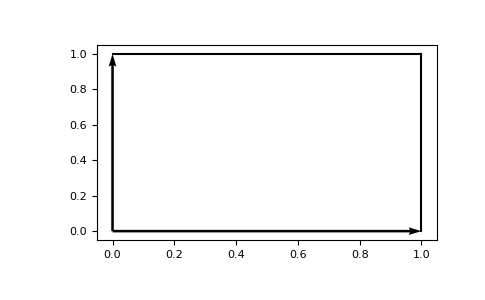
- lattpy.plotting.draw_unit_cell(ax, vectors, outlines=True, **kwargs)[source]
Draws the basis vectors and unit cell.
- Parameters:
- axAxes
The axes for drawing the text.
- vectorsfloat or (D, D) array_like
The vectors defining the basis.
- outlinesbool, optional
If True the box define dby the basis vectors (unit cell) is drawn.
- **kwargs
Additional keyword arguments for drawing the lines.
- Returns:
- lineslist
A list of the plotted lines.
Examples
>>> from lattpy import plotting
>>> import matplotlib.pyplot as plt
>>> vectors = np.array([[1, 0], [0, 1]])
>>> fig, ax = plt.subplots()
>>> _ = plotting.draw_unit_cell(ax, vectors)
>>> plt.show()

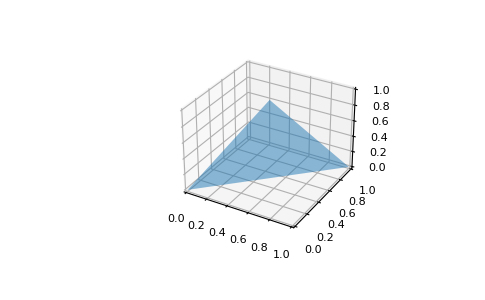
- lattpy.plotting.draw_surfaces(ax, vertices, **kwargs)[source]
Draws a 3D surfaces defined by a set of vertices.
- Parameters:
- axAxes3D
The axes for drawing the surface.
- verticesarray_like
The vertices defining the surface.
- **kwargs
Additional keyword arguments for drawing the lines.
- Returns:
- surfPoly3DCollection
The surface object.
Examples
>>> from lattpy import plotting
>>> import matplotlib.pyplot as plt
>>> vertices = [[0, 0, 0], [1, 1, 0], [0.5, 0.5, 1]]
>>> fig = plt.figure()
>>> ax = fig.add_subplot(111, projection="3d")
>>> _ = plotting.draw_surfaces(ax, vertices, alpha=0.5)
>>> plt.show()

- lattpy.plotting.interpolate_to_grid(positions, values, num=(100, 100), offset=(0.0, 0.0), method='linear', fill_value=nan)[source]
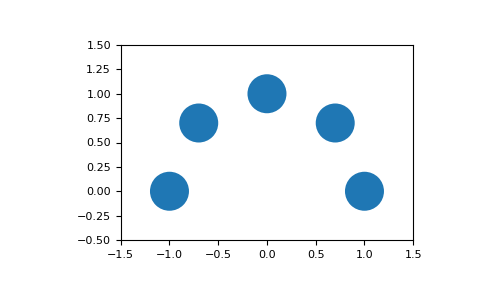
- lattpy.plotting.draw_sites(ax, points, radius=0.2, **kwargs)[source]
Draws multiple circles with a scaled radius.
- Parameters:
- axAxes
The axes for drawing the points.
- points(N, D) np.ndarray
The positions of the points to draw.
- radiusfloat
The radius of the points. Scaling is only supported for 2D plots!
- **kwargs
Additional keyword arguments for drawing the points.
- Returns:
- point_collCircleCollection or PathCollection
The circle or path collection.
Examples
>>> from lattpy import plotting
>>> import matplotlib.pyplot as plt
>>> fig, ax = plt.subplots()
>>> points = np.array([[1, 0], [0.7, 0.7], [0, 1], [-0.7, 0.7], [-1, 0]])
>>> _ = plotting.draw_sites(ax, points, radius=0.2)
>>> _ = ax.set_xlim(-1.5, +1.5)
>>> _ = ax.set_ylim(-0.5, +1.5)
>>> plotting.set_equal_aspect(ax)
>>> plt.show()
- lattpy.plotting.connection_color_array(num_base, default='k', colors=None)[source]
Construct color array for the connections between all atoms in a lattice.
- Parameters:
- num_baseint
The number of atoms in the unit cell of a lattice.
- defaultstr or int or float or tuple
The default color of the connections.
- colorsSequence[tuple], optional
list of colors to override the defautl connection color. Each element has to be a tuple with the first two elements being the atom indices of the pair and the third element the color, for example
[(0, 0, 'r')].
- Returns:
- color_arrayList of List
The connection color array
Examples
>>> connection_color_array(2, "k", colors=[(0, 1, "r")])
[['k', 'r'], ['r', 'k']]